


Next: About this document ...
Up: Odd-even staggering of binding
Previous: Bibliography
Figures
Figure 1:
Neutron OES filter
 (6)
plotted as a function of neutron number N (N-odd).
Results for different isotones are marked by dots.
The average values of
 are indicated by gray bars.
Experimental data were taken from Ref. [23].
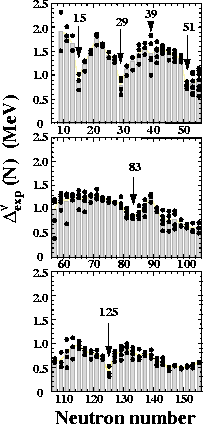 |
Figure 2:
Same as in Fig. 1 except
for the proton OES filter
 (6)
plotted as a function of Z (Z-odd).
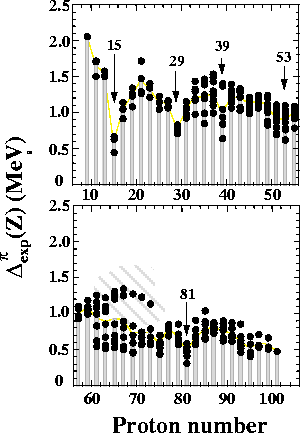 |
Figure 3:
Average values of neutron and proton OES filters
(6)
plotted as functions of the neutron and proton numbers
(both N and Z odd),
respectively.
Experimental masses were taken from Ref. [23].
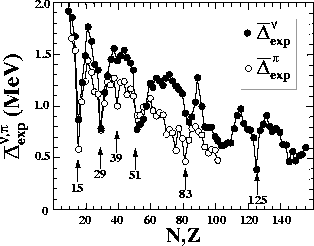 |
Figure 4:
Three-mass filters
 (1)
(thick solid and dotted lines) calculated for the exact binding energies in
the deformed-shell-plus-pairing model with
 =16 for the case of weak (G/d=0.1),
intermediate (G/d=0.3), and strong pairing (G/d=0.5).
The single-particle spectrum is uniform
(ek=d k), except for the seventh level
which is shifted up in energy by d/4 (i.e,
e7=7.25 d).
The equivalent gap parameters (56)
are shown by thin lines.
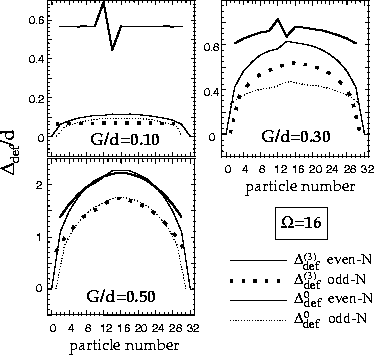 |
Figure 5:
Similar to Fig. 4
except for the energy-spacing filters (7)
 calculated for G/d=0.1, 0.2, 0.3,
and 0.4.
The nearly-equidistant single-particle spacings
are marked by dots.
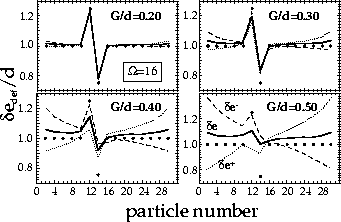 |
Figure 6:
Three-mass filters
 (1)
calculated for the exact (thick lines) and BCS (thin lines)
binding energies in
the deformed-shell-plus-pairing model with
 =16 and a nearly-equidistant spectrum.
Solid and dotted lines show results for even and odd values of N,
respectively.
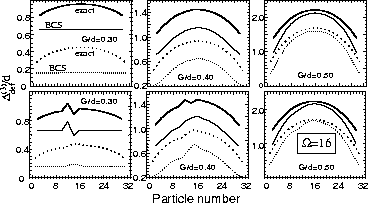 |
Figure 7:
Similar to Fig. 6 except for
the energy-spacing filters (7)
 .
The single-particle spacings
are marked by dots.
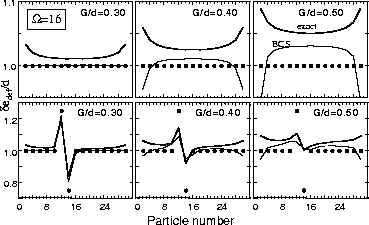 |
Figure 8:
Relative error (in percent)
of the second-order expressions for the binding energies
of the equidistant level model with  =16
in the weak (left, G/d
 1; Sec. 3.1.1) and strong
(right, d/G
 1; Sec. 3.1.2) pairing limits.
In the weak pairing limit, calculations were performed for N=4, 5,
14, and 15.
To realize the strong-pairing situation, only large particle
numbers, N=14 and 15, were considered in the d/G
 1 case.
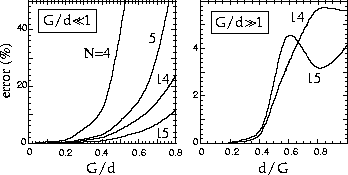 |
Figure 9:
Exact binding energies
 (solid line)
of particles in the j=19/2 single-j shell
interacting with the pure QQ interaction (G=0).
Energies obtained within the HFB approximation are shown with the dashed line.
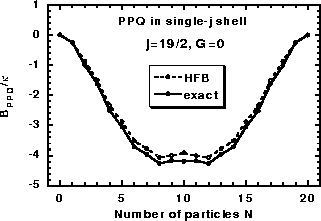 |
Figure 10:
Exact values of the three-mass filter
 within the j=19/2
PPQ calculated for the pairing strengths
  indicated at the right-hand side.
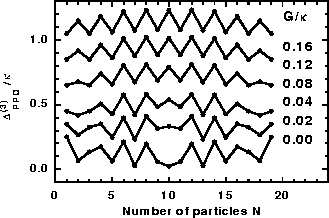 |
Figure 11:
Exact values of the OES
 (6) (a)
and of the energy spacing
 (8) (b)
calculated within the j=19/2 PPQ model.
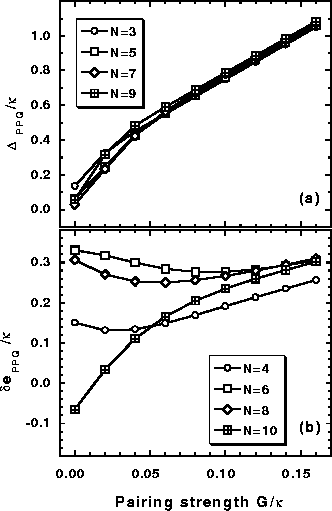 |
Figure 12:
Same as in Fig. 11 except for the HFB results.
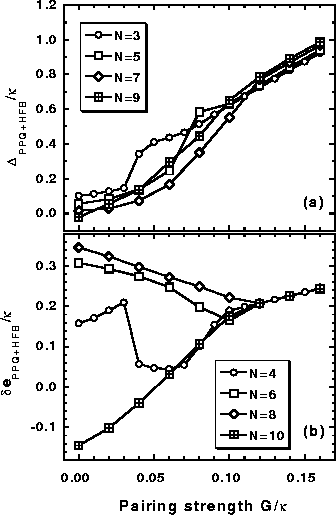 |
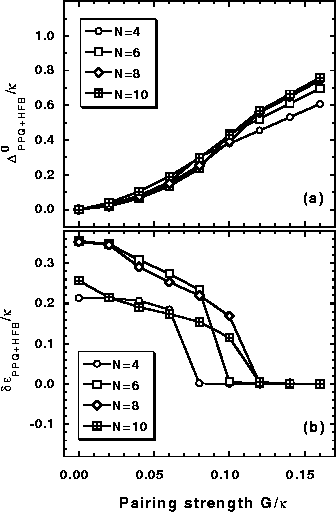
Figure 13:
Same as in Fig. 11 except for the
 HFB
order parameter (56) and the differences of
HFB canonical energies
HFB
order parameter (56) and the differences of
HFB canonical energies
 (65).
(65).
 |


Next: About this document ...
Up: Odd-even staggering of binding
Previous: Bibliography
Jacek Dobaczewski
2000-03-09


