This is a very simple (but very useful) python script that takes a .png image and exctracts one of the basic colors (RGB), makes full horizontal bining of the signal, and finds distance between two consecutive transitions in intensity. In my case this coresponds to finding layers thickness in TEM micrographs. The script assumes that there is a scale bar between 9/10 and end of the picture. You have to provide length of this scale bar (in nm) as one of the parameters. The script producess a picture as shown below, and a .csv file with all the values of layers thickness. What you can see to the right of the TEM micrograph are horizontal profiles of each of the basic colors RGB: red, green, blue. In this image I have chosen blue profile to perform finding of layers thickness.
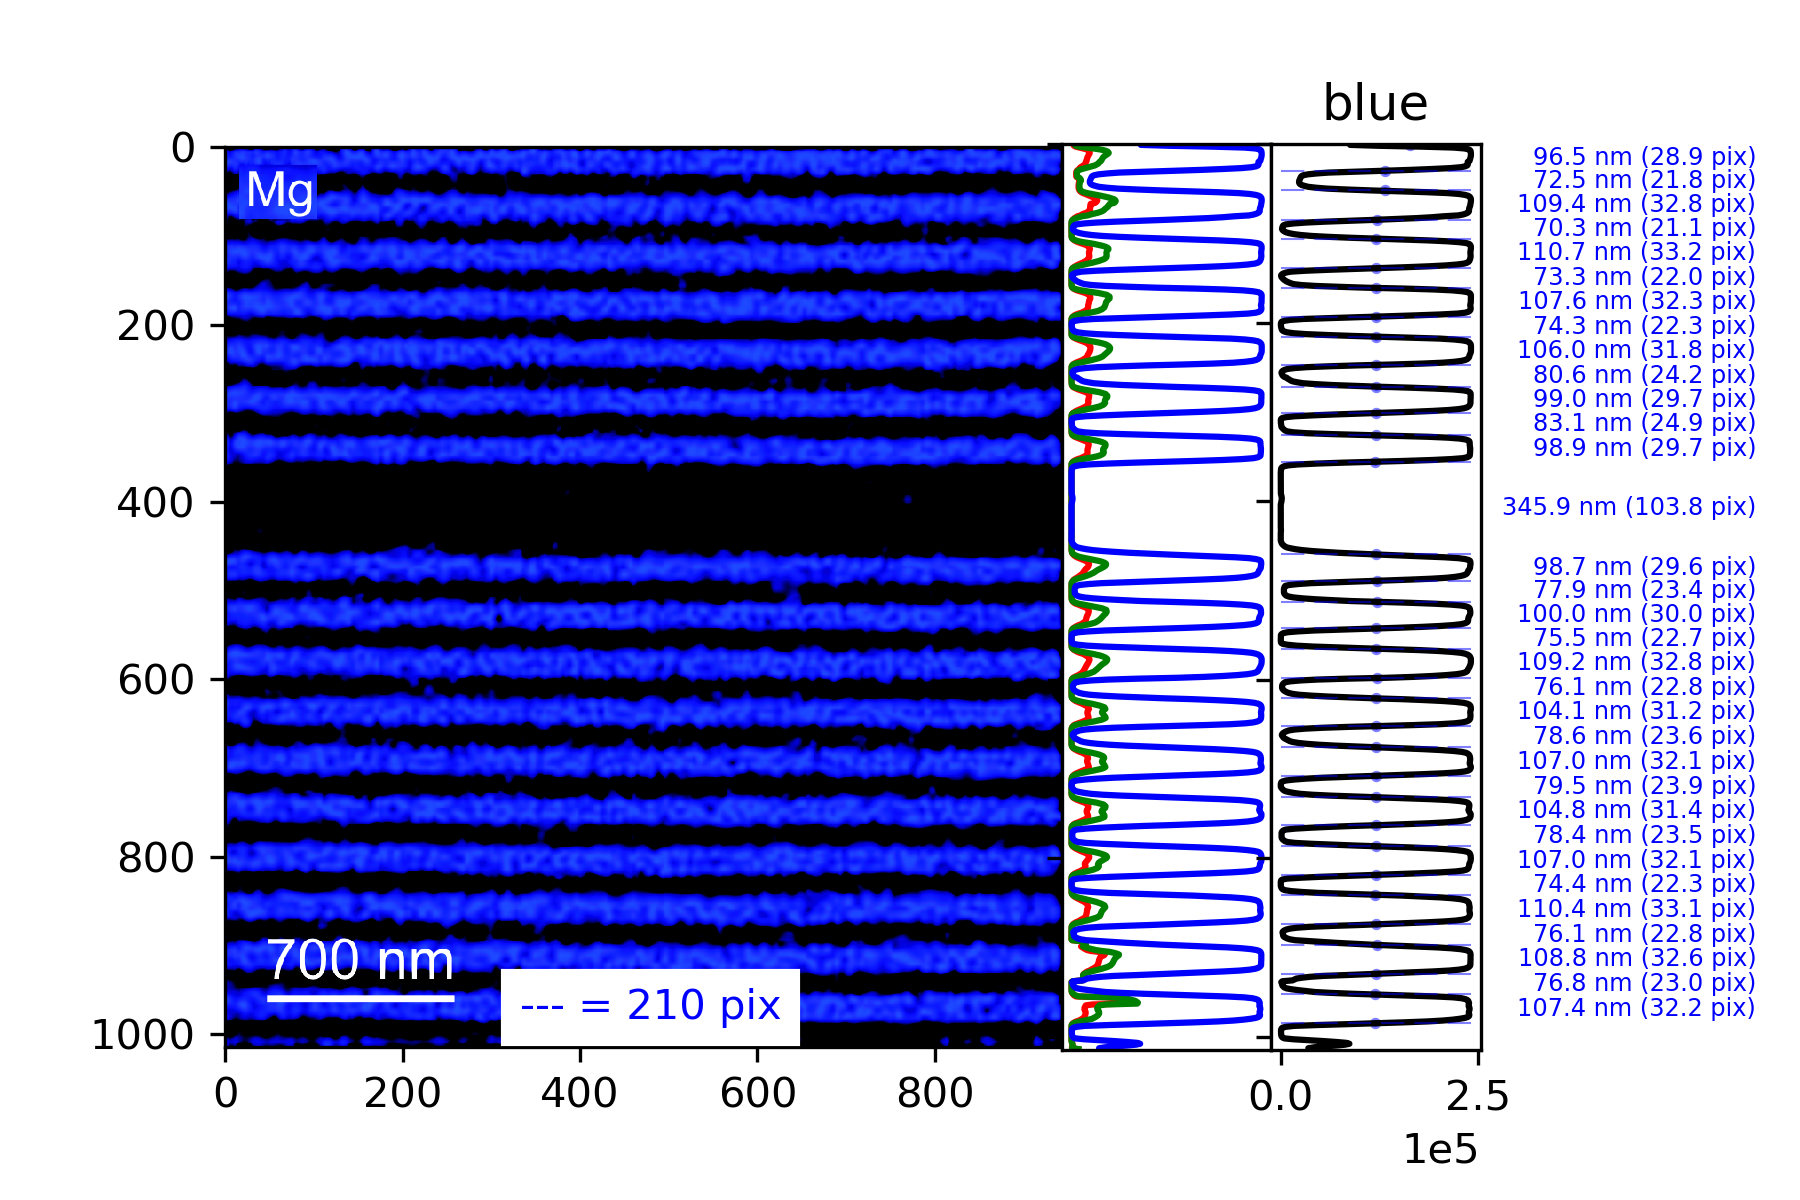
TEM micrograph of a sample
Original picture by dr hab. inż. Jolanta Borysiuk, University of Warsaw
You can find the python code and contribute on this project's page on Github.