Joanna Falzmann
Distributions
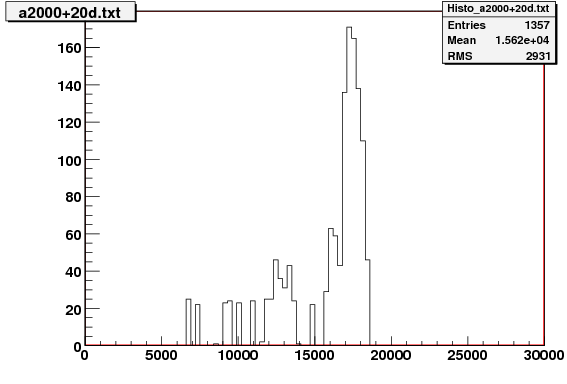
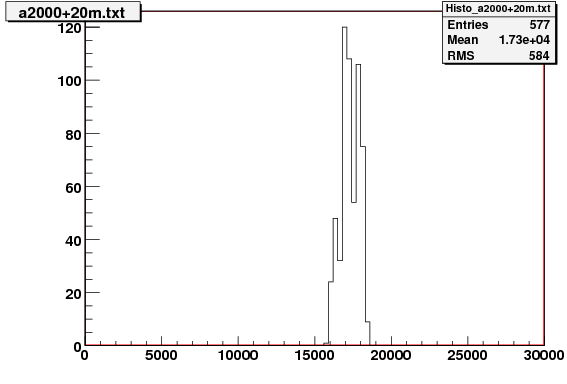
Two typical distributions of the number of stars are shown in the charts below. The first was prepared using all the measurements, the second is only of that data collected during the nights when the moon's phase was smaller than 30%. The difference between these two distributions is evident.


Explanation
The second figure shows characteristic number of stars for one field (part of the Sky). That number (mean value and sigma) is used for estimation of the quality of measurements. If number of stars registered by camera on the picture is less than characteristic mean value minus 1.5 sigma then frame is marked "bad" and information about it is stored in database.